There is a question most merchants ask when sales drop: "Should I increase the ad budget?" And most of the time the right answer is: no, wait. Look at your conversion rate first.
Because if you have 1,000 visitors a day and only 10 order, more ads will bring more visitors at the same weak rate, meaning more money in Facebook's pocket and few orders in yours. But if you raise the rate from 1% to 1.5%, you have increased your orders by 50% without spending a single extra pound.
In this article we explain how to calculate your conversion rate correctly (including a very common mistake, especially in Egypt), what normal numbers look like, where customers drop off in your store, and a practical 30-day plan to raise the rate.
In short: conversion rate = orders ÷ visitors × 100, and the global average is between 2% and 3%. In Egypt, also calculate it on delivered orders only, because cash on delivery comes with refusals. The fastest ways to raise it: show the shipping fee early, let people order without creating an account, keep the form short, and confirm orders quickly.
What is the conversion rate?
Simply put: out of every 100 people who visited your store, how many ordered?
Conversion rate = orders ÷ visitors × 100
If you had 4,000 visitors in a month and received 60 orders, your conversion rate is 1.5%.
The mistake most merchants in Egypt make
In Europe and the US the customer pays online, so an order = money. But here a large share of orders are cash on delivery, which means an order can be cancelled at confirmation or refused at the door. So if you calculate the conversion rate on orders placed, you get numbers that look good on paper and bad in the bank.
That is why we recommend tracking two numbers:
- Initial conversion rate = orders ÷ visitors. This measures the quality of the store and the page.
- Real conversion rate = delivered orders ÷ visitors. This is what reaches your pocket.
The gap between the two tells you how much you lose after the customer orders, and that needs completely different fixes (order confirmation, deposits, shipping speed).
What is a normal rate?
There is no single right number for everyone. Global reports put the e-commerce average at around 2% to 3%, and Smart Insights, for example, measured 2.5% in Q3 2025. But the number varies a lot depending on:
- Product type: personal care and food convert much higher than decor and furniture, because the buying decision is faster and the price is lower.
- Traffic source: a visitor coming from a Google search for the product name is different from someone who saw an ad while scrolling TikTok.
- Device: most visits come from mobile, and mobile has historically converted lower than desktop, though the gap shrinks every year.
- Price: a 150 EGP product is different from a 3,000 EGP product.
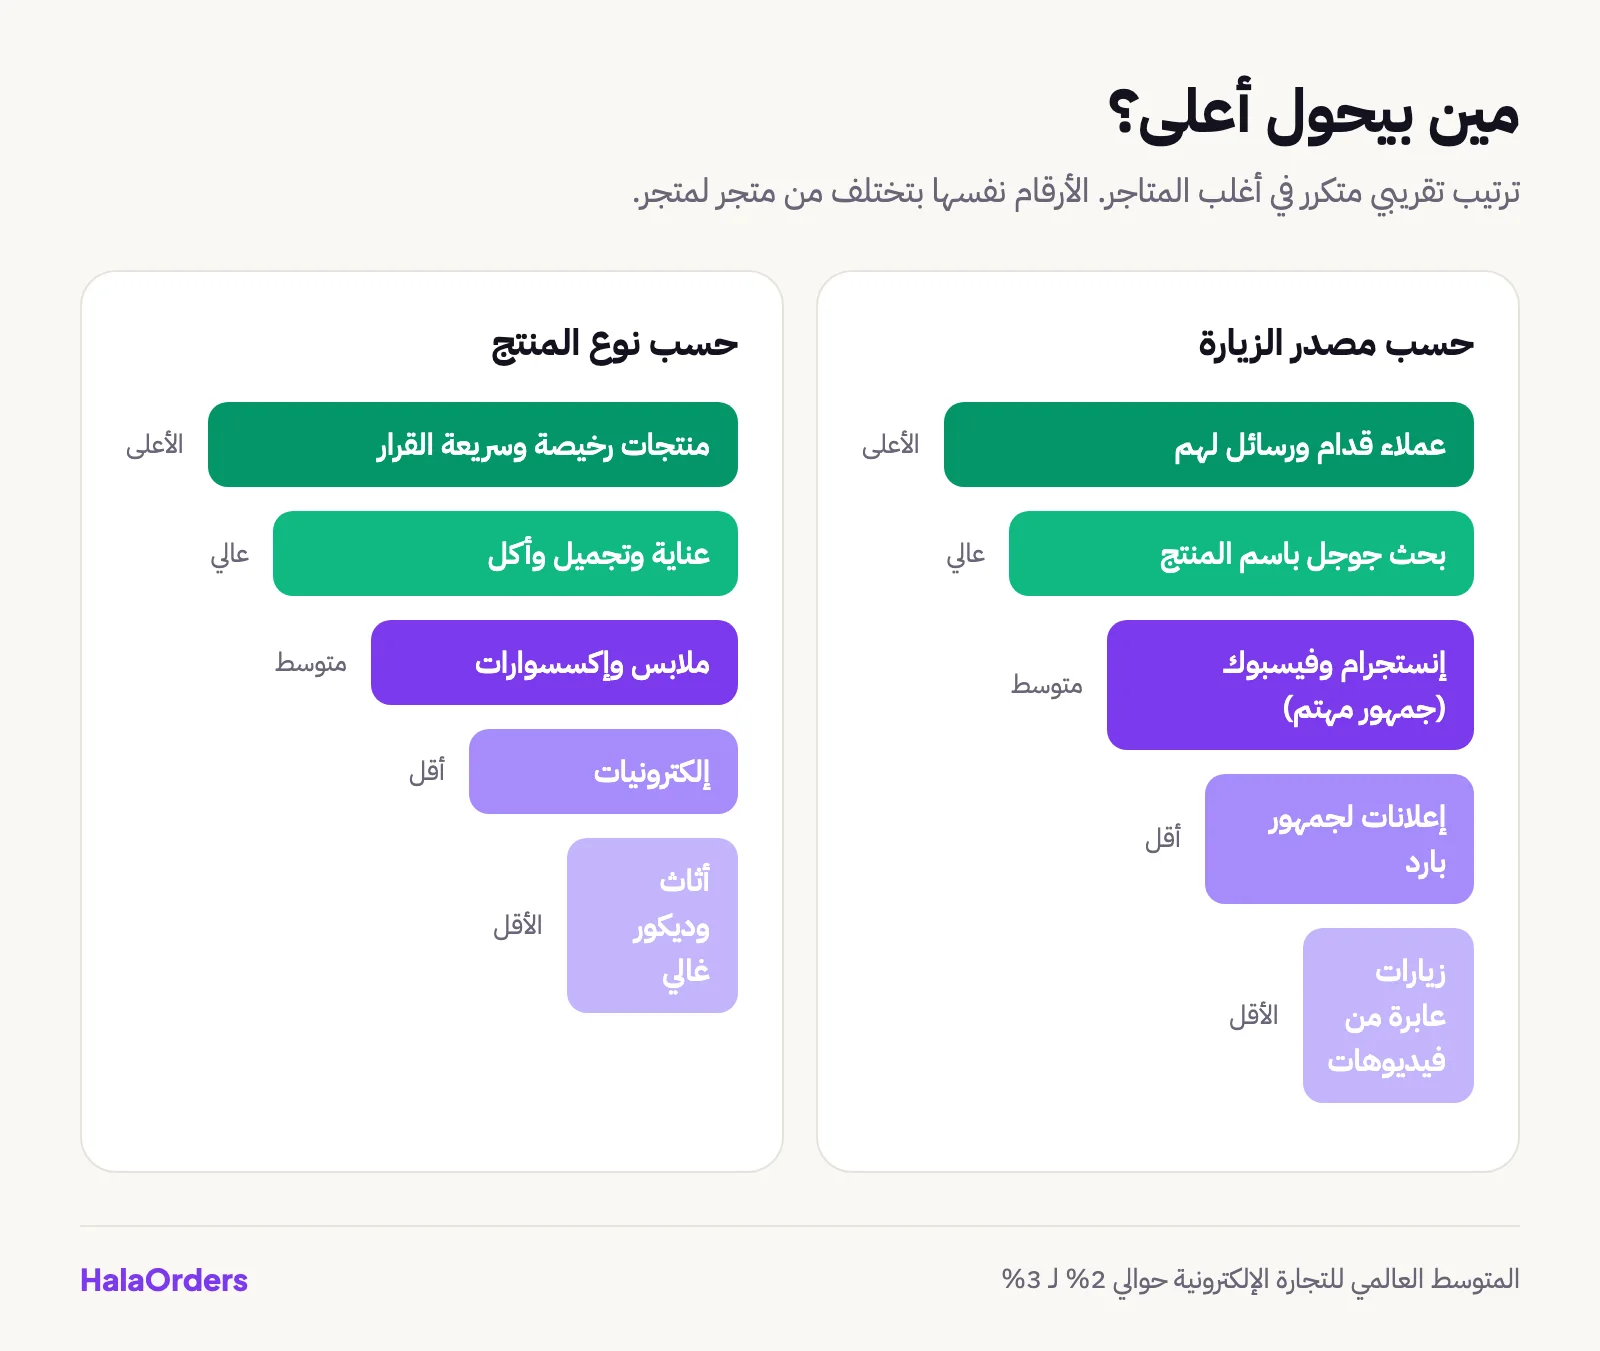
Our advice: don't compare yourself with a global average. Compare yourself with last month, and compare each traffic source separately. If visits from TikTok ads convert at 0.6% and from Instagram at 1.8%, that is a clear budget decision.
The sales funnel: where do customers drop off?
The conversion rate is one number at the end, but behind it is a chain of steps, and you lose people at each one. Take the example of a clothing store with 10,000 visitors a month:
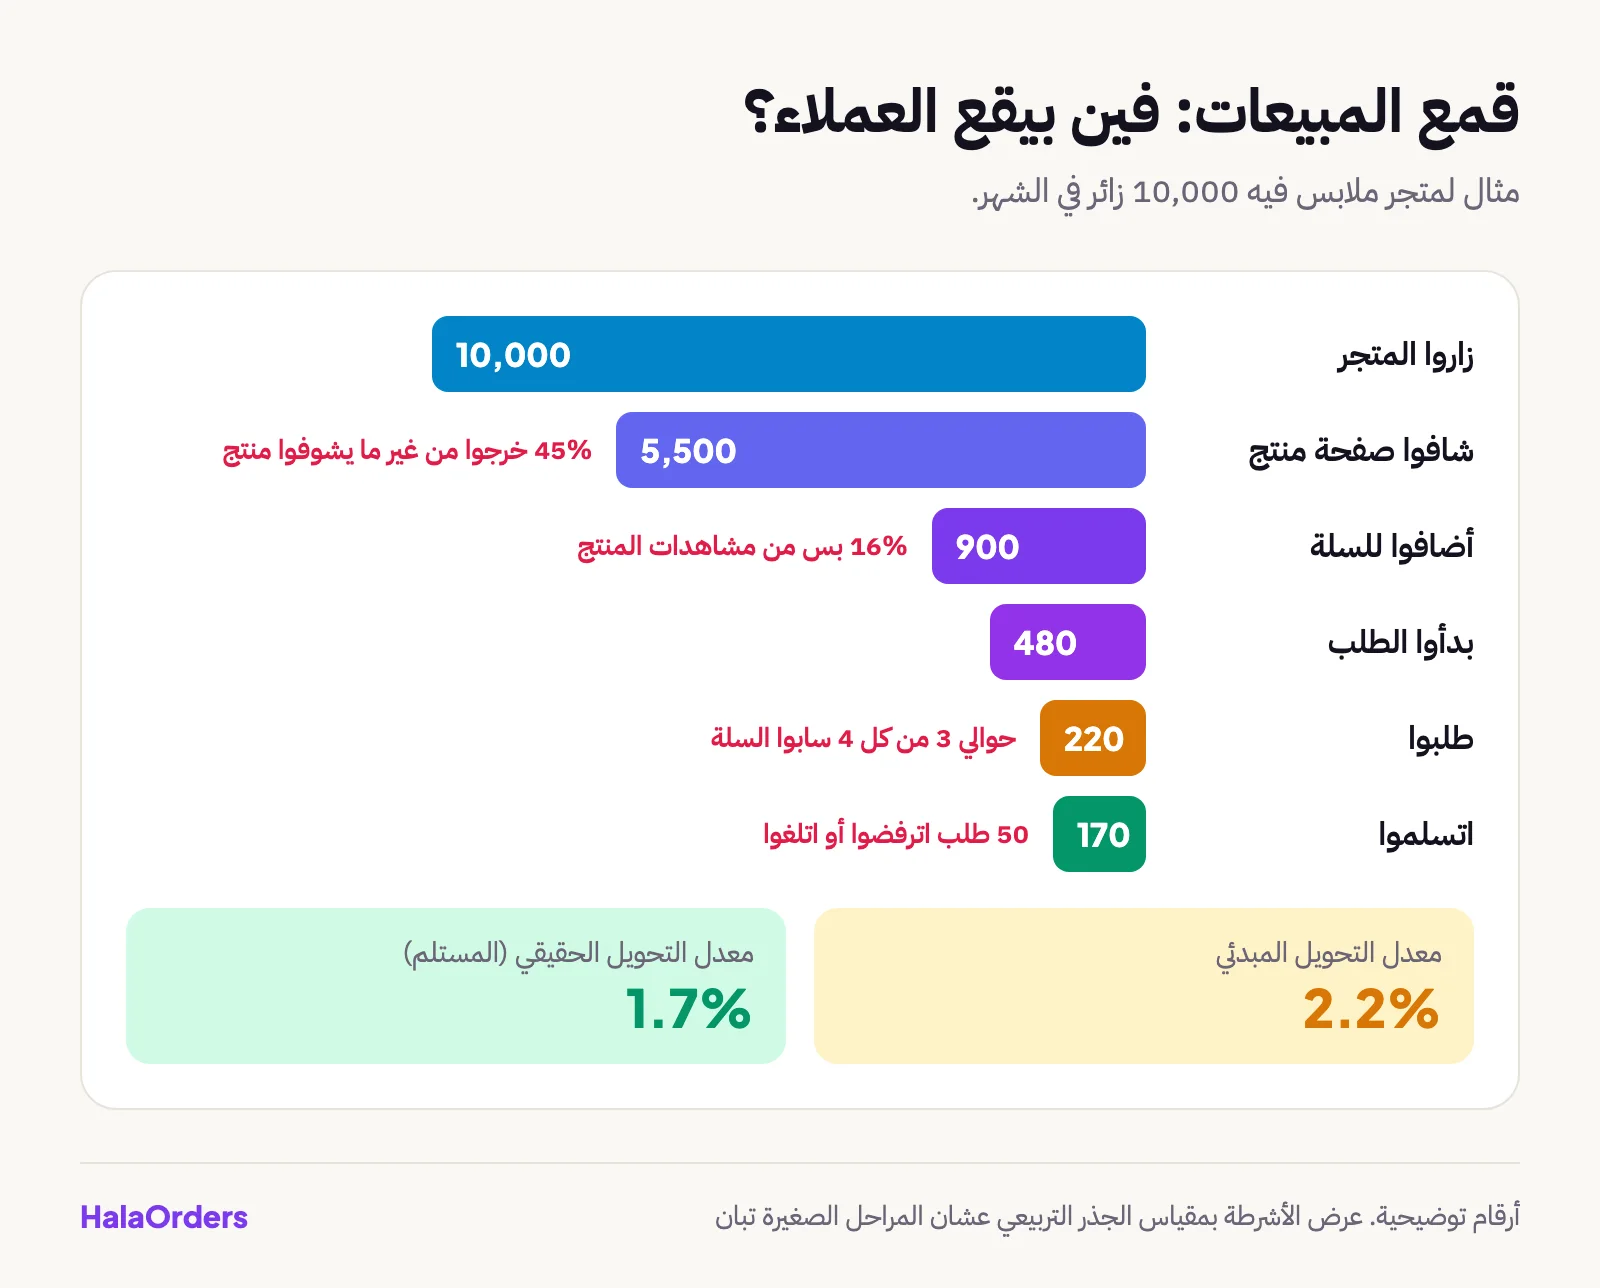
These numbers are an illustration, but this shape repeats in most stores. Notice:
- 45% of visitors never saw a single product. They landed on the home page and left. That usually means the ad sends people to the wrong place, the page is slow, or the first screen doesn't tell the customer where they are.
- Of the 5,500 who saw a product, only 900 added it to the cart (16%). The problem here is the product page: photos, price, sizes, trust.
- Of the 900 who added to cart, only 220 actually ordered. About 3 out of 4 abandoned the cart, the biggest leak in any store in the world.
- 50 of the 220 orders were not delivered. That is the loss that happens after the order.
Why do customers abandon the cart?
The Baymard Institute has collected studies on cart abandonment for years, and their latest average is that about 70% of carts are abandoned before the order is completed. When they asked shoppers (in a survey of US shoppers) why they abandoned their order, excluding those who were just browsing, the reasons were:
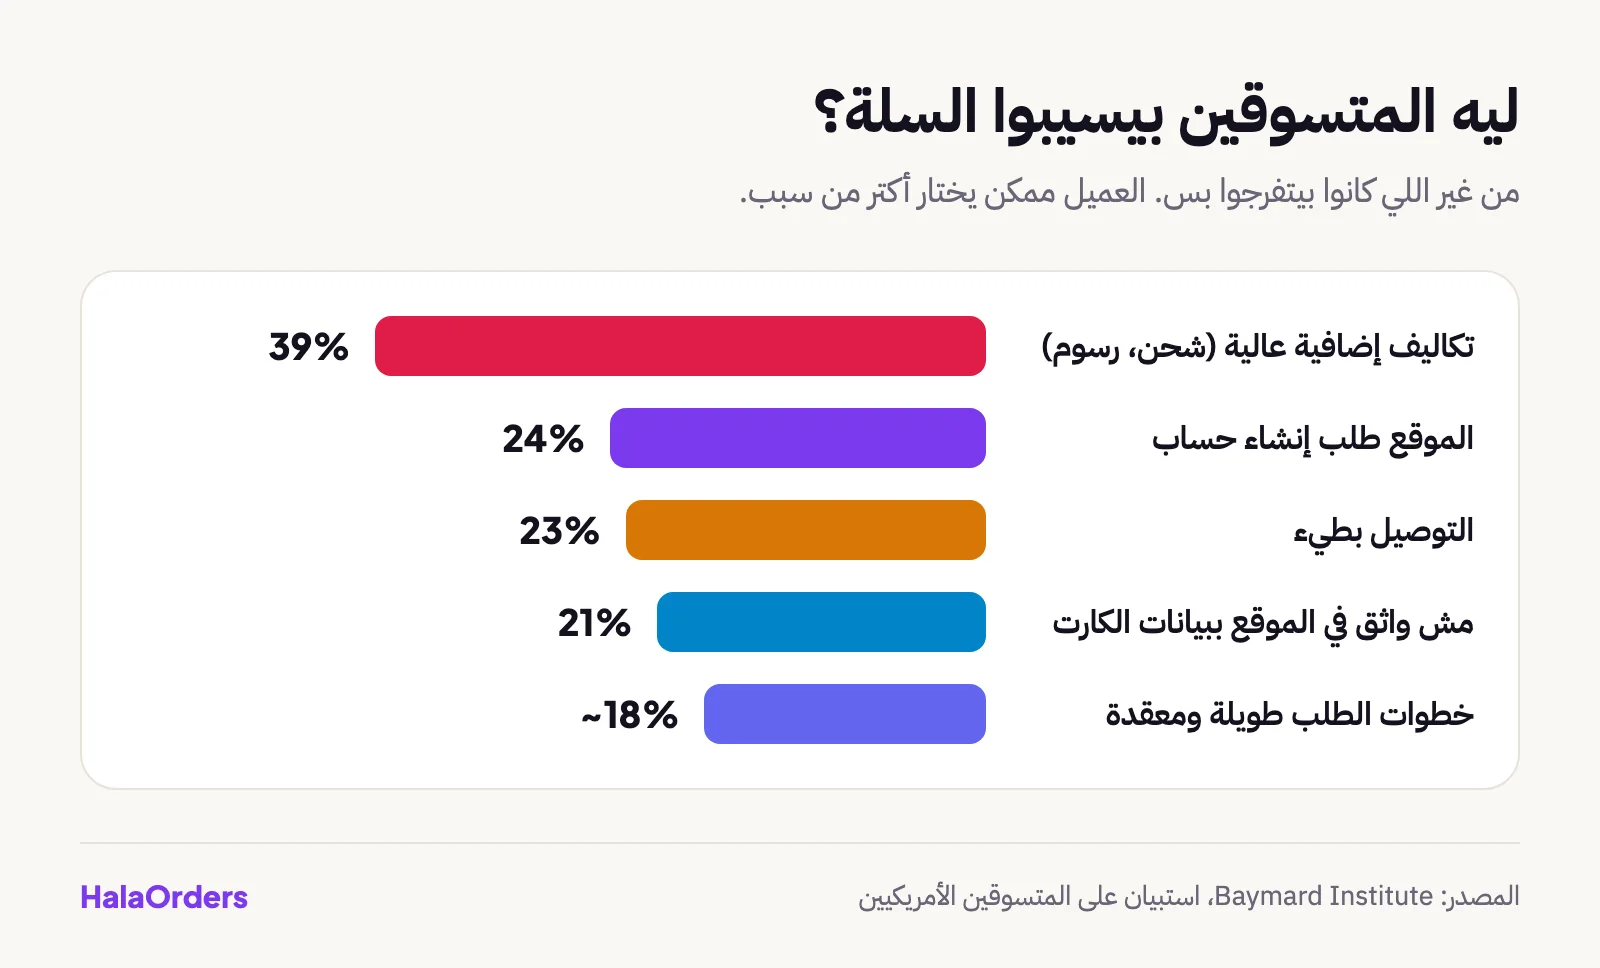
These numbers come from the US market, but the reasons are very familiar to any Egyptian merchant, and shipping and trust may be even higher here. The good news is that most of these reasons are in your hands, not the customer's.
A map of fixes: each stage has its cure
Stage 1: from ad to product
- Send the ad to the product page itself or to a landing page, not to the home page. The visitor saw a specific product in the ad, and that is what they want to see.
- Speed: every second of loading loses people, especially on a mobile network. An uncompressed 3 MB product photo can ruin everything.
- The first screen on mobile must show the product photo, name, price and a clear button, without the customer having to scroll.
Stage 2: from product to cart
- Lots of real photos from different angles, and a short video if you can. The customer can't touch the product, so the photos are the touch.
- The price before and after the discount, clearly, without asterisks and conditions.
- A size chart for clothing, and dimensions in centimeters for decor and furniture.
- Clear stock: if a size is sold out, show it. There is nothing worse than a customer ordering and then getting a call saying "sorry, it's not available".
- Quantity offers: "2 pieces at 10% off" encourages the customer to add more than one item and raises the average order.
Stage 3: from cart to order
- Show the shipping fee early. This is the number one reason worldwide. Show it for each governorate before the customer presses "Place order".
- No account required. Let the customer order with their name, phone and address, nothing more.
- A short form. Every extra field loses you people. Do you really need the email? The national ID number? Usually not.
- Several payment methods: cash, card, wallet, InstaPay. Each method opens the door to a different type of customer.
- Trust signals next to the order button: the exchange policy, delivery time, a real phone or WhatsApp number.
Stage 4: from order to delivery
- Confirm the order quickly with a message or a short call, especially for cash on delivery.
- A deposit on orders at risk of refusal: expensive ones, or governorates with a high refusal rate.
- Ship the same day or the next. Every day of delay gives the customer a chance to change their mind.
The simple math that changes everything
Let's see the effect of a small improvement in conversion rate on a store that spends 15,000 EGP a month on ads, at 3 EGP per visit (that is, 5,000 visitors):
| Conversion rate | Orders per month | Ad cost per order | Difference from 1% |
|---|---|---|---|
| 1% | 50 | 300 EGP | - |
| 1.5% | 75 | 200 EGP | +50% orders |
| 2% | 100 | 150 EGP | +100% orders |
| 2.5% | 125 | 120 EGP | +150% orders |
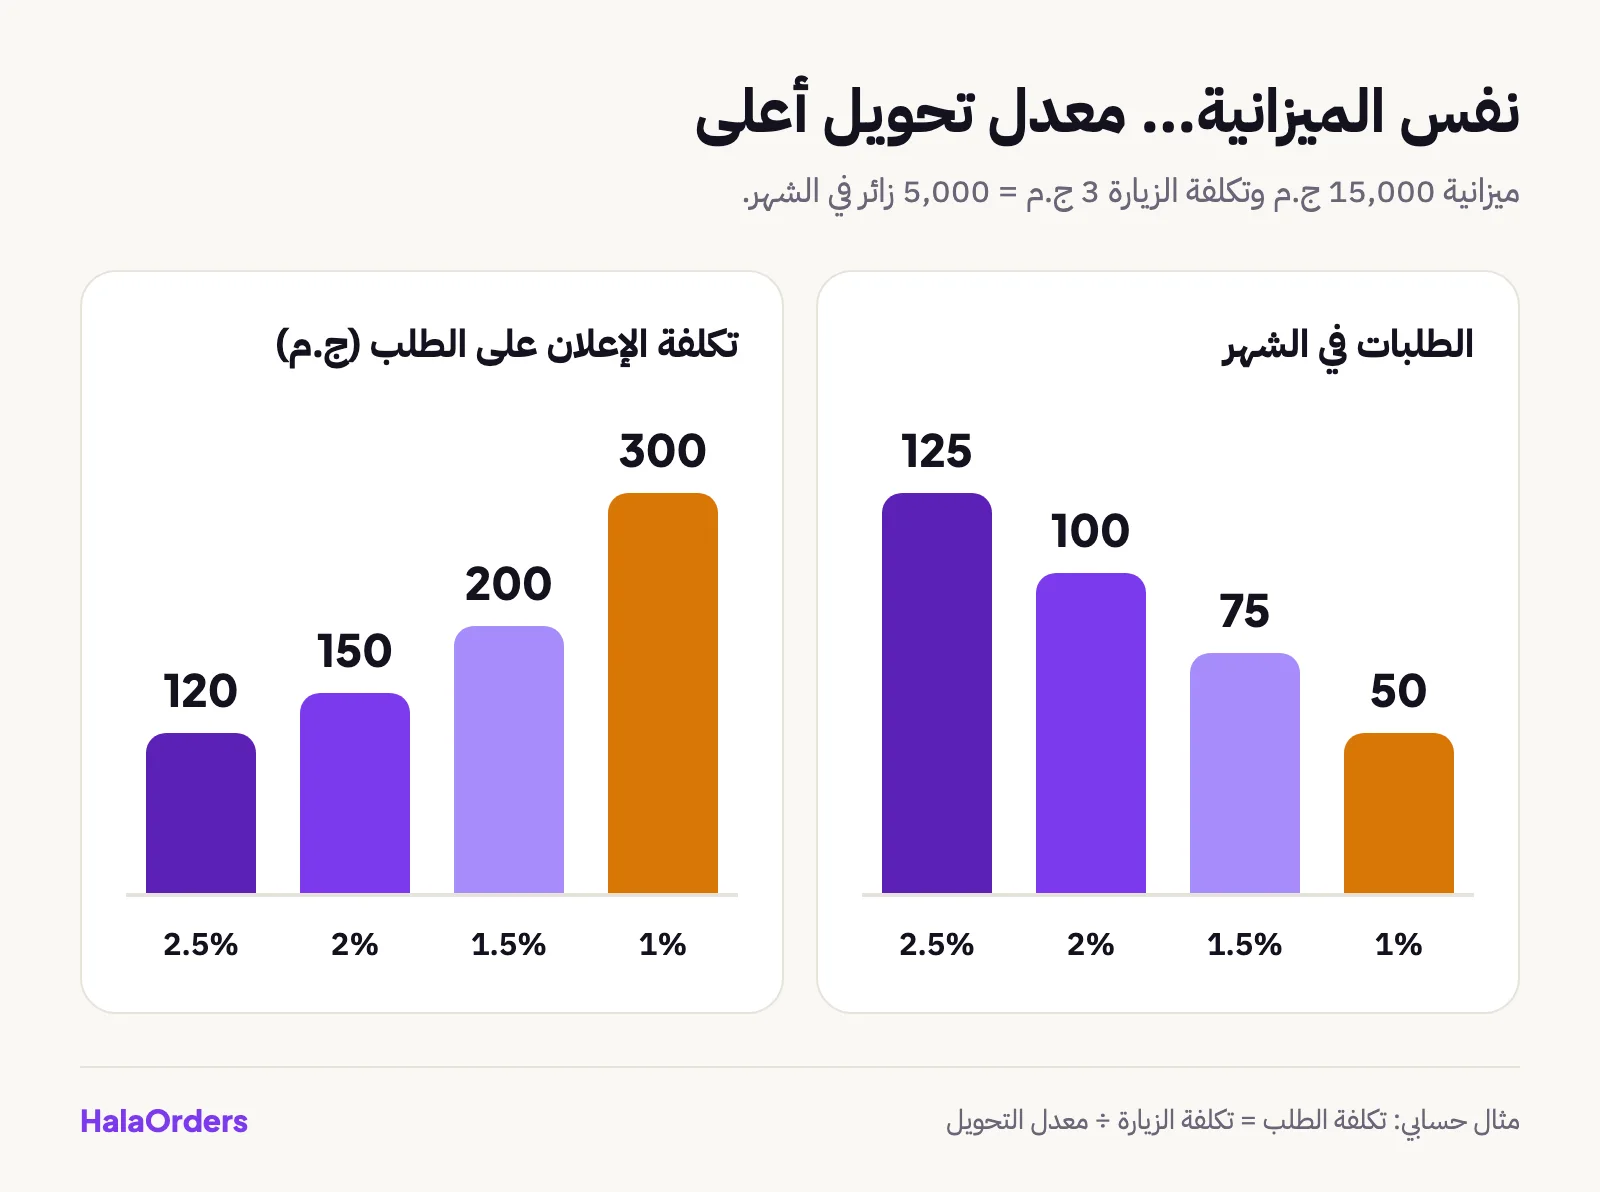
Notice that going from 1% to 2% doesn't need a miracle. It can come from just two or three things: a faster page, a clear shipping fee and a shorter form. At the same time the cost per order halves, so a campaign that was losing money can start making money. Calculate this with your own product's numbers in the profit calculator.
How to measure correctly
- Measure visitors from one reliable source, Google Analytics 4 for example. Facebook "reach" numbers are not visitors.
- Separate the sources: Facebook ads, TikTok, Google, direct visits. Each has a different conversion rate.
- Install the pixel on your store and connect it to the purchase event, so the ad platform learns who actually buys.
- Review the numbers weekly, not daily. Days fluctuate, and a week gives a clearer picture.
- Change one thing at a time if you compare before and after. Or better: use an A/B test and compare two designs at the same time.
A 30-day plan to raise your conversion rate
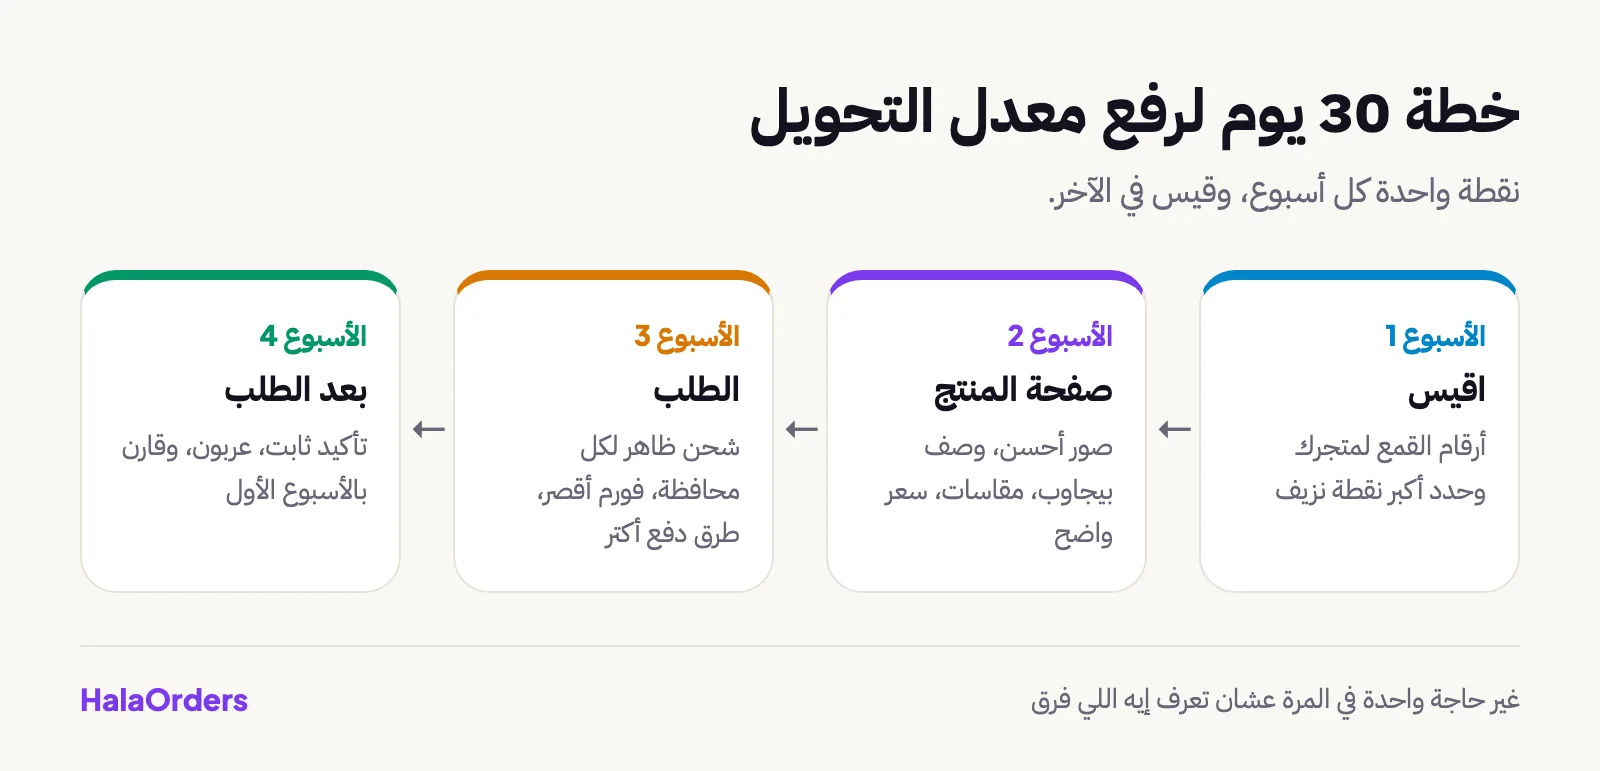
- Week one: measure. Pull the funnel numbers above for your store: visitors, product views, add to cart, orders, delivered. Find the biggest leak.
- Week two: the product page. Better photos, a description that answers the customer's questions, a size chart, a clear price.
- Week three: checkout. Shipping shown for each governorate, a shorter form, more payment methods.
- Week four: after the order. A consistent confirmation process, deposits on orders at risk of refusal, then compare the numbers with week one.
HalaOrders solves several of these points by itself
You don't need to code or install plugins. On HalaOrders:
- Customers order without creating an account, with their name, phone and address.
- Delivery fees are set per governorate and city and shown to the customer on the order page before they confirm.
- Product photos are resized and converted to WebP automatically, with a thumbnail for lists, so the store opens faster on mobile.
- Landing pages with the order form on the same page, quantity offers, a countdown, and A/B testing that picks the best converting design by itself.
- Several payment methods: cash on delivery with a deposit, Paymob, InstaPay, Vodafone Cash.
- Promo codes and offers that nudge hesitant customers.
- Connecting the Meta Pixel, TikTok Pixel and Google Analytics from the dashboard.
And if you are still preparing your store, compare the plans and choose the one that fits your size.
The bottom line
Conversion rate is the cheapest way to increase your sales. Before you increase your ads, know your real rate (on delivered orders, not ordered ones), find where customers drop off, and fix one point each week. Half a point more can be the difference between a losing campaign and a winning one.
Frequently asked questions
How do I calculate my store's conversion rate?
Divide the number of orders by the number of visitors in the same period and multiply by 100. If you got 60 orders from 4,000 visitors, your conversion rate is 1.5%. With cash on delivery, also calculate it on delivered orders only.
What is a good conversion rate for an online store?
The global average is around 2% to 3%, but the number varies a lot by product type, traffic source and price. What matters most is comparing yourself with last month, and comparing each traffic source separately.
Why do customers abandon the cart without ordering?
According to Baymard the most common reasons are: extra costs such as shipping showing up late (39%), being asked to create an account (24%), slow delivery (23%) and not trusting the site (21%).
Should I increase my ad budget or improve my conversion rate first?
Improve your conversion rate first. Raising it from 1% to 2% doubles your orders from the same budget and halves your cost per order.