Try this: open your store on your phone, on mobile data rather than Wi-Fi, and count until the product photo appears. If you get past 3, lots of customers are closing the page before you do.
Speed is one of those things merchants postpone because it is "technical". In reality it is one of the things that most directly affects sales, and it also affects your Google ranking and your ad costs. In this article we explain speed in a merchant's language, with some technical detail for anyone who wants to go deeper.
In short: store speed directly affects sales: a 0.1 second improvement raised conversion by 8.4% on retail sites according to Deloitte. Google measures speed with three metrics (LCP under 2.5 seconds, INP under 200 milliseconds, CLS under 0.1), and the biggest quick win is compressing product photos as WebP or AVIF.
The numbers: speed is money
- A Google study of more than 10,000 mobile sites found that 53% of mobile visits are abandoned if the page takes longer than 3 seconds to load. The study is a bit old (2016), but people's expectations of speed have only gone up since.
- Deloitte's Milliseconds Make Millions study (commissioned by Google, covering 37 brands and more than 30 million visits) found that improving mobile speed by just 0.1 seconds raised conversion on retail sites by 8.4%, and raised average order value by 9.2%.
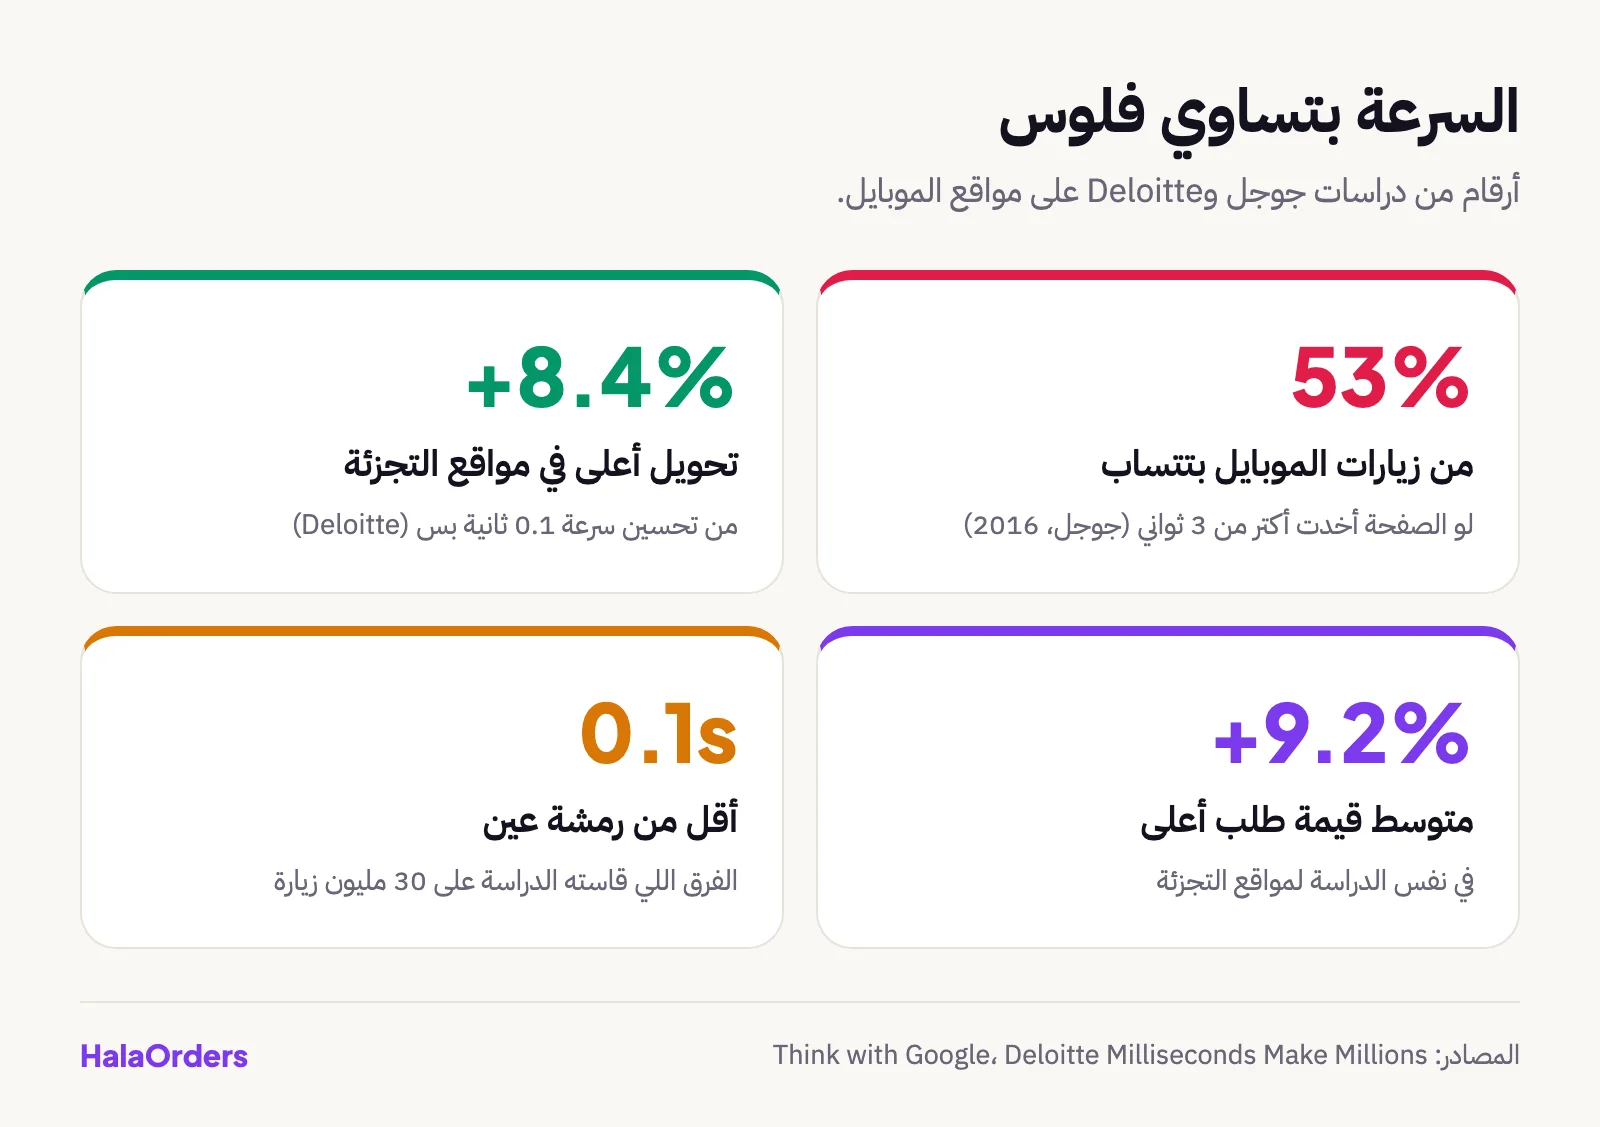
0.1 seconds! That is less than the blink of an eye. Now imagine a store that takes 6 seconds instead of 3.
In Egypt it matters even more, because a large share of customers:
- Browse on mid-range or cheap Android phones, with processors much slower than the iPhone you test on.
- Are on mobile data that can be weak in many places, or has run out and dropped to a slow speed.
- Come from an ad, so they aren't invested in you yet. Any delay is reason enough to go back to the feed.
Core Web Vitals: the three numbers Google looks at
Google measures the real user experience on your site with three metrics called Core Web Vitals, and uses them among its ranking signals in search results:
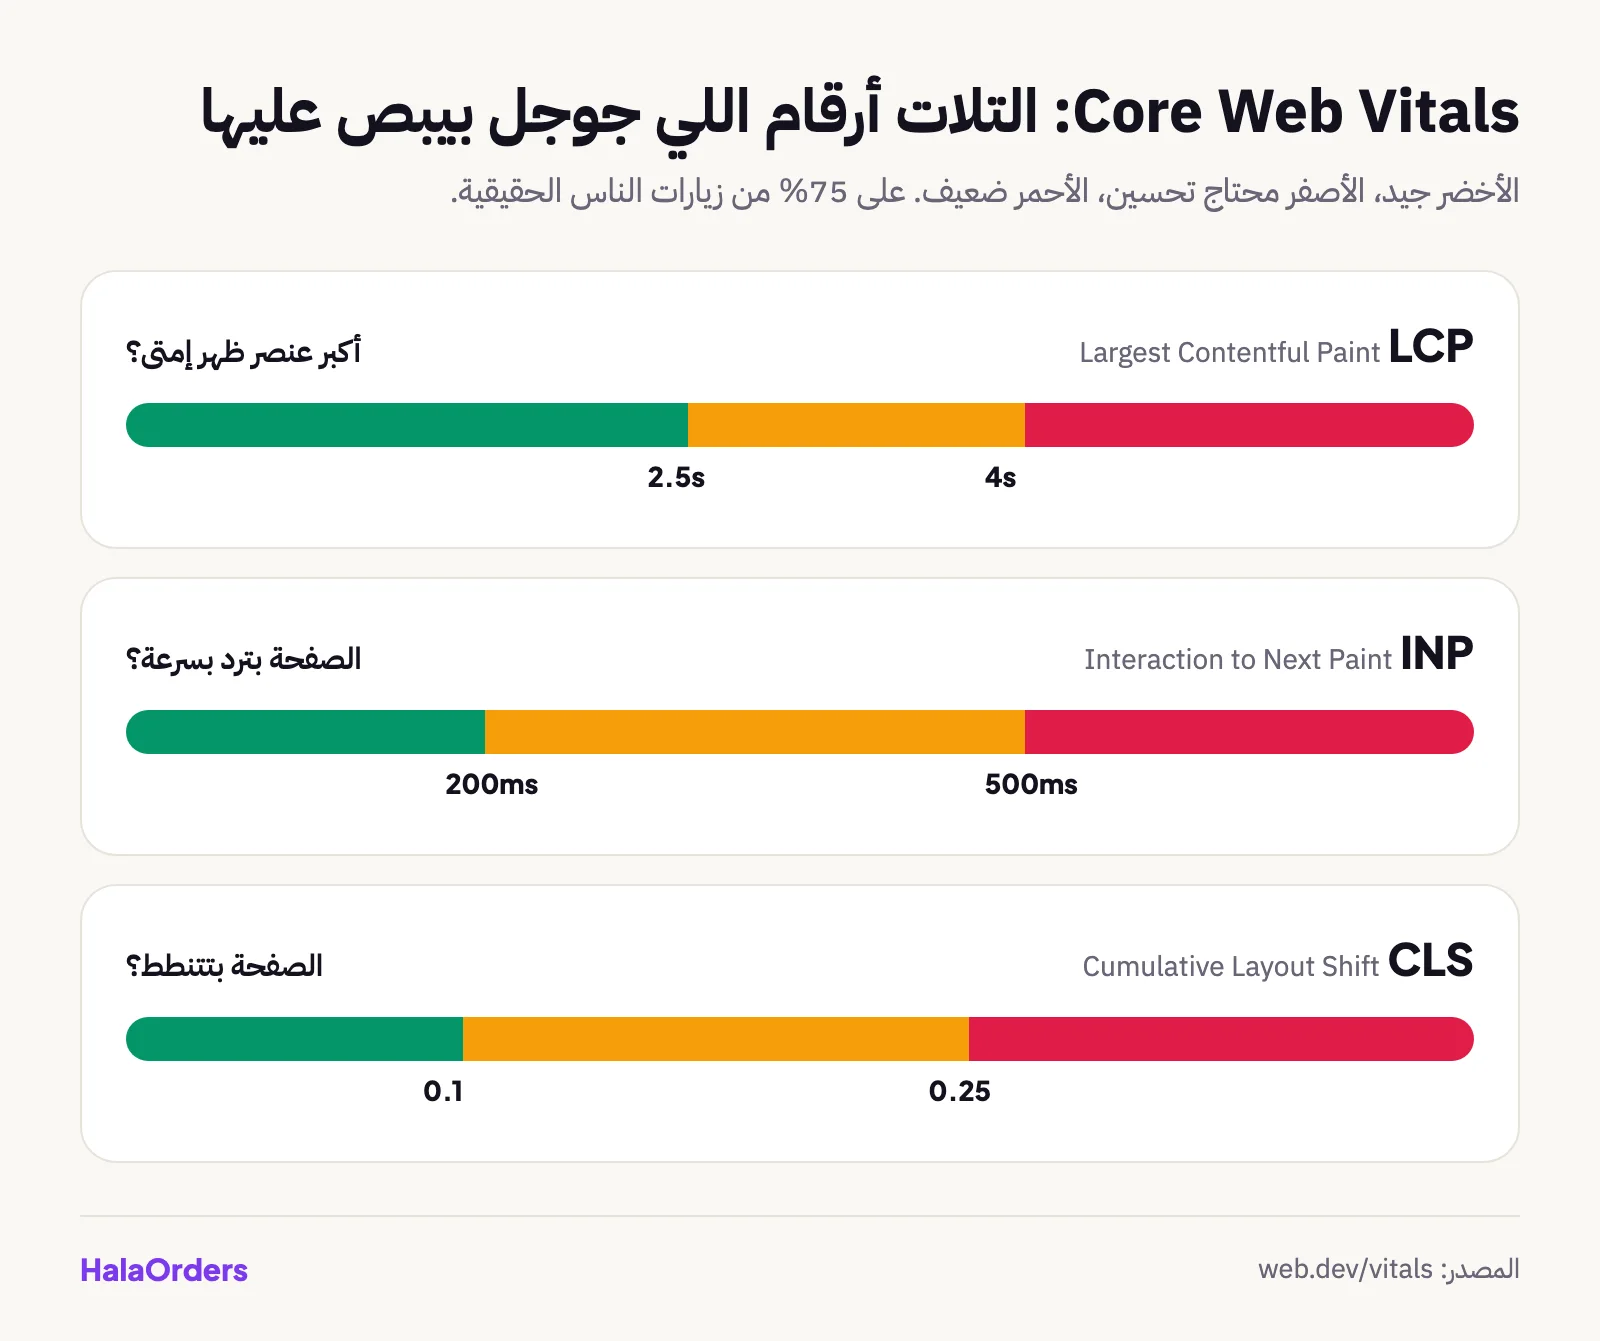
1. LCP: when does the biggest thing on the page appear?
Largest Contentful Paint is the time until the largest element on the first screen appears, which in a store is usually the product photo or the banner. Good: 2.5 seconds or less.
2. INP: does the page respond quickly when the customer taps?
Interaction to Next Paint measures the time from when the customer taps a button (like choosing a size or "Add to cart") until the screen actually changes. Good: 200 milliseconds or less. This metric replaced FID in March 2024, and it is harder, because it measures every tap, not just the first.
3. CLS: does the page jump around?
Cumulative Layout Shift measures how much elements move while the page loads. It has surely happened to you: you go to tap something, the page jumps and you tap something else. Good: 0.1 or less.
Google considers a page good if 75% of real people's visits pass these thresholds. So it isn't enough that it is fast for you.
What happens when a customer opens the page?
To fix it, you need to know where the time goes. Here is a simplified view of a product page loading:
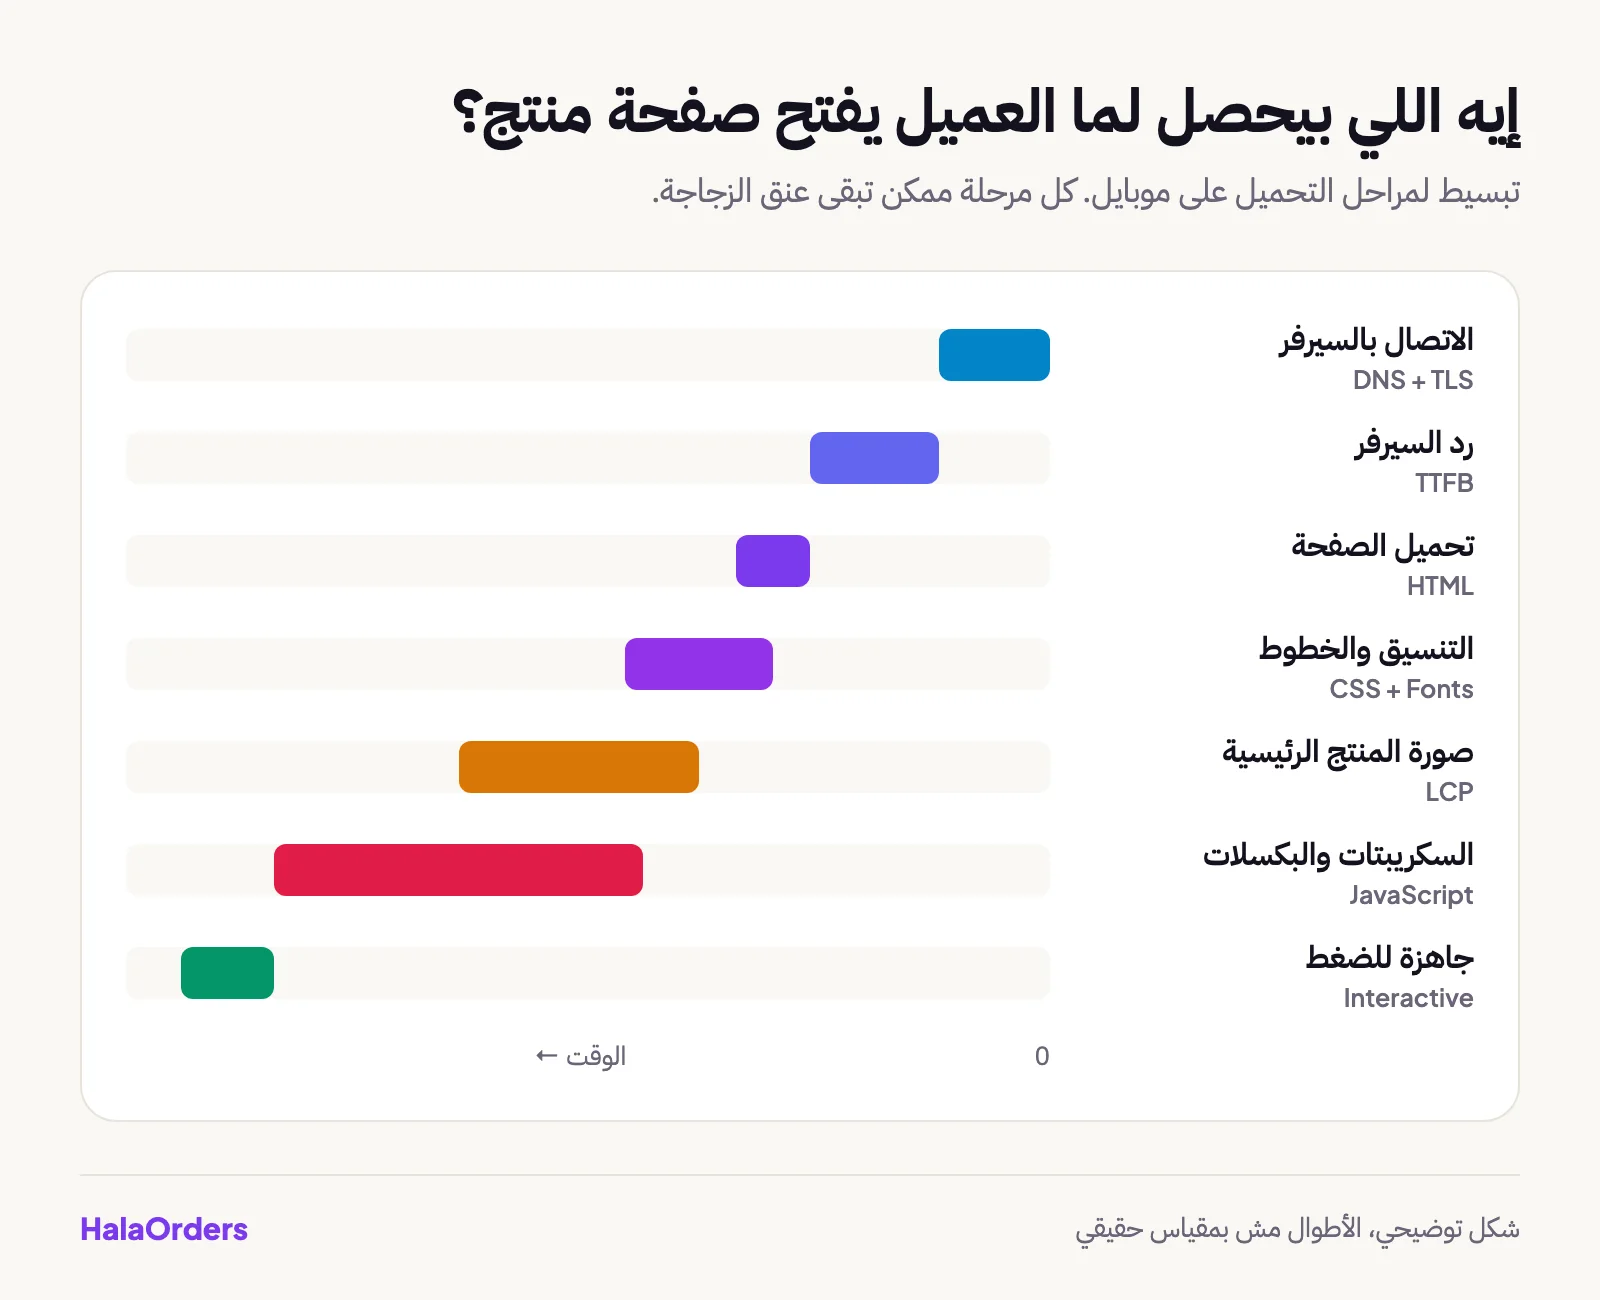
Any of these stages can be the bottleneck:
- Server response (TTFB): if the server is slow, far away or runs lots of queries, everything after it is delayed.
- Render-blocking files: CSS, fonts and scripts at the top of the page that the browser waits for before drawing anything.
- The product photo: usually the largest file on the page, and if it isn't compressed it is what ruins the LCP.
- Third-party scripts: the Facebook pixel, TikTok, analytics, chat, heatmaps... each one costs processor time, and that ruins the INP.
Images: the biggest win for the least effort
We took a real product photo from the Trendy House store on HalaOrders, 1440×1440 in size, and tried several formats on it. Here is what we got:
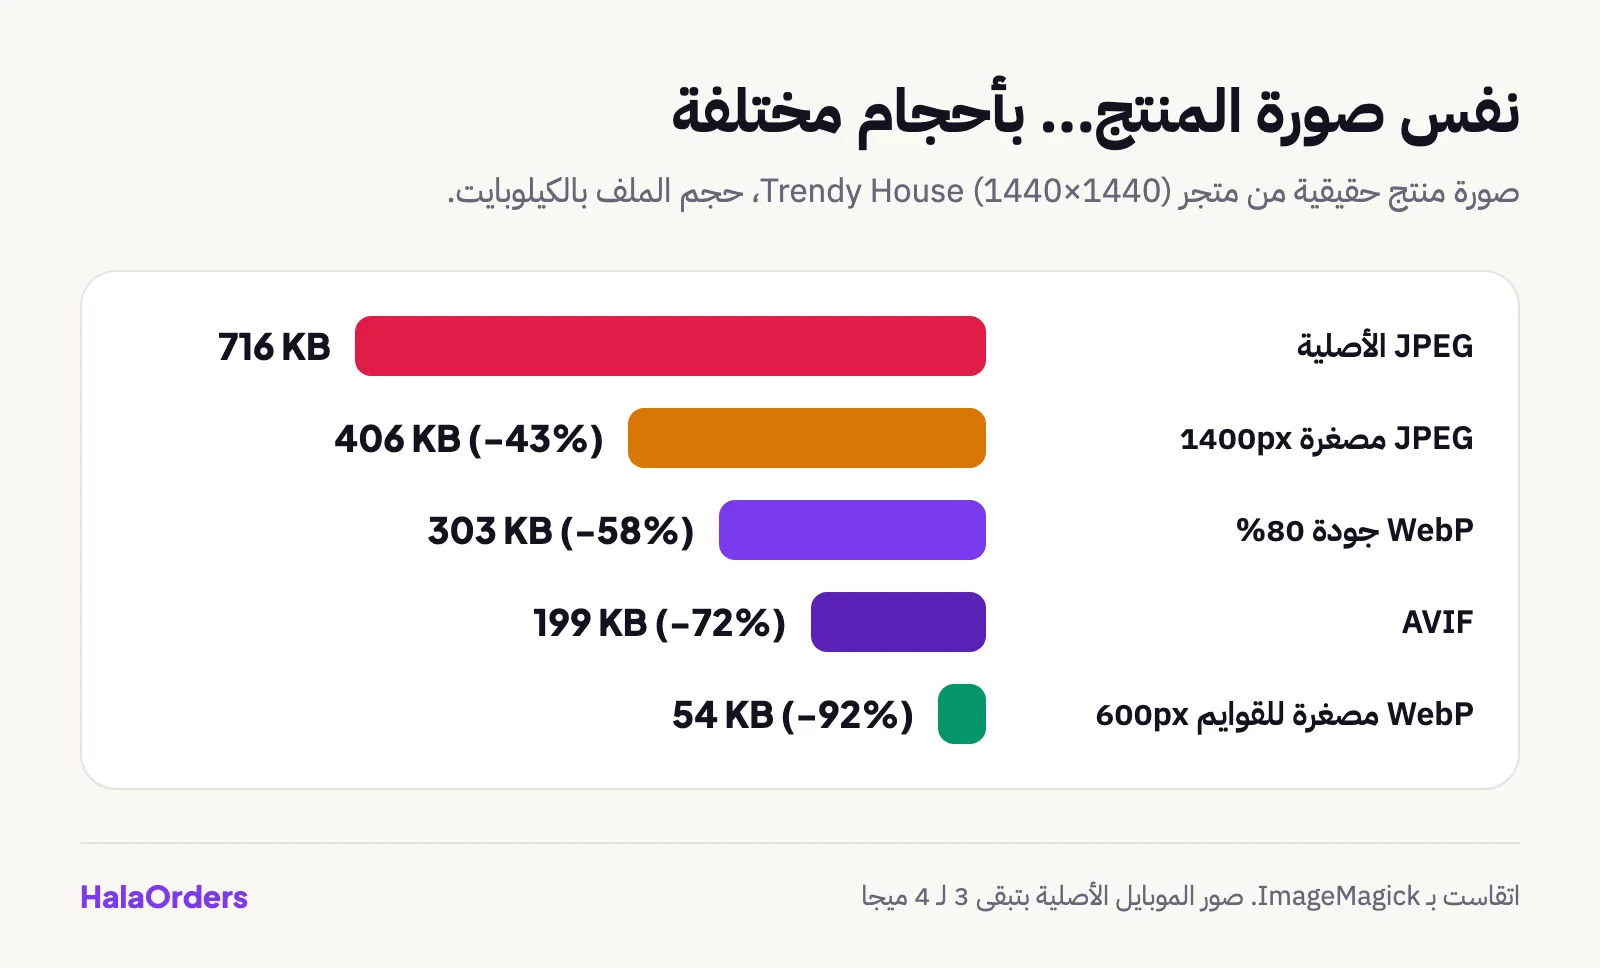
| Format | Size | Saving compared with the original |
|---|---|---|
| Original JPEG (1440 px) | 716 KB | - |
| JPEG at 82% quality (1400 px) | 406 KB | 43% |
| WebP at 80% quality (1400 px) | 303 KB | 58% |
| AVIF (1400 px) | 199 KB | 72% |
| WebP thumbnail for lists (600 px) | 54 KB | 92% |
And this photo had already been prepared for a website. Photos straight from a modern phone are 3 or 4 MB, and some merchants upload them as they are. A category page with 20 products like that means 60 MB on your customer's data plan. It will never sell.
The most important image rules:
- Don't show an image larger than its space. An image in a card 300 pixels wide doesn't need to be 4000 pixels. Make a small version for lists and a large one for the product page.
- Use WebP or AVIF. All modern browsers support them.
- Set the width and height in the code, so the browser reserves the space and the page doesn't jump (CLS).
- Lazy-load the images further down with
loading="lazy", but never lazy-load the main product photo; you want that one to load with priority.
<!-- The main photo: high priority and not lazy -->
<img src="/products/dress-1400.webp"
     width="1400" height="1400"
     fetchpriority="high"
     alt="Black long-sleeved linen dress">

<!-- List photos further down: they load as the customer gets close -->
<img src="/products/dress-600.webp"
     width="600" height="600"
     loading="lazy" decoding="async"
     alt="Black linen dress">
Third-party scripts: each one has a price
Every service you add to your store adds JavaScript that the browser has to download and run. On a mid-range phone, a few scripts can make the page look loaded while it doesn't respond to touch.
- Install only what you need. The Meta pixel if you run Facebook ads, the TikTok pixel if you run TikTok ads. Not both "just in case".
- Review old add-ons every few months. A chat tool you tried once and forgot about is still loading on every page.
- Load scripts after the content (
deferorasync) instead of blocking the page from rendering. - Don't put an autoplaying YouTube video at the top of the page. Show an image, and load the video when the customer taps it.
How to measure your store's speed
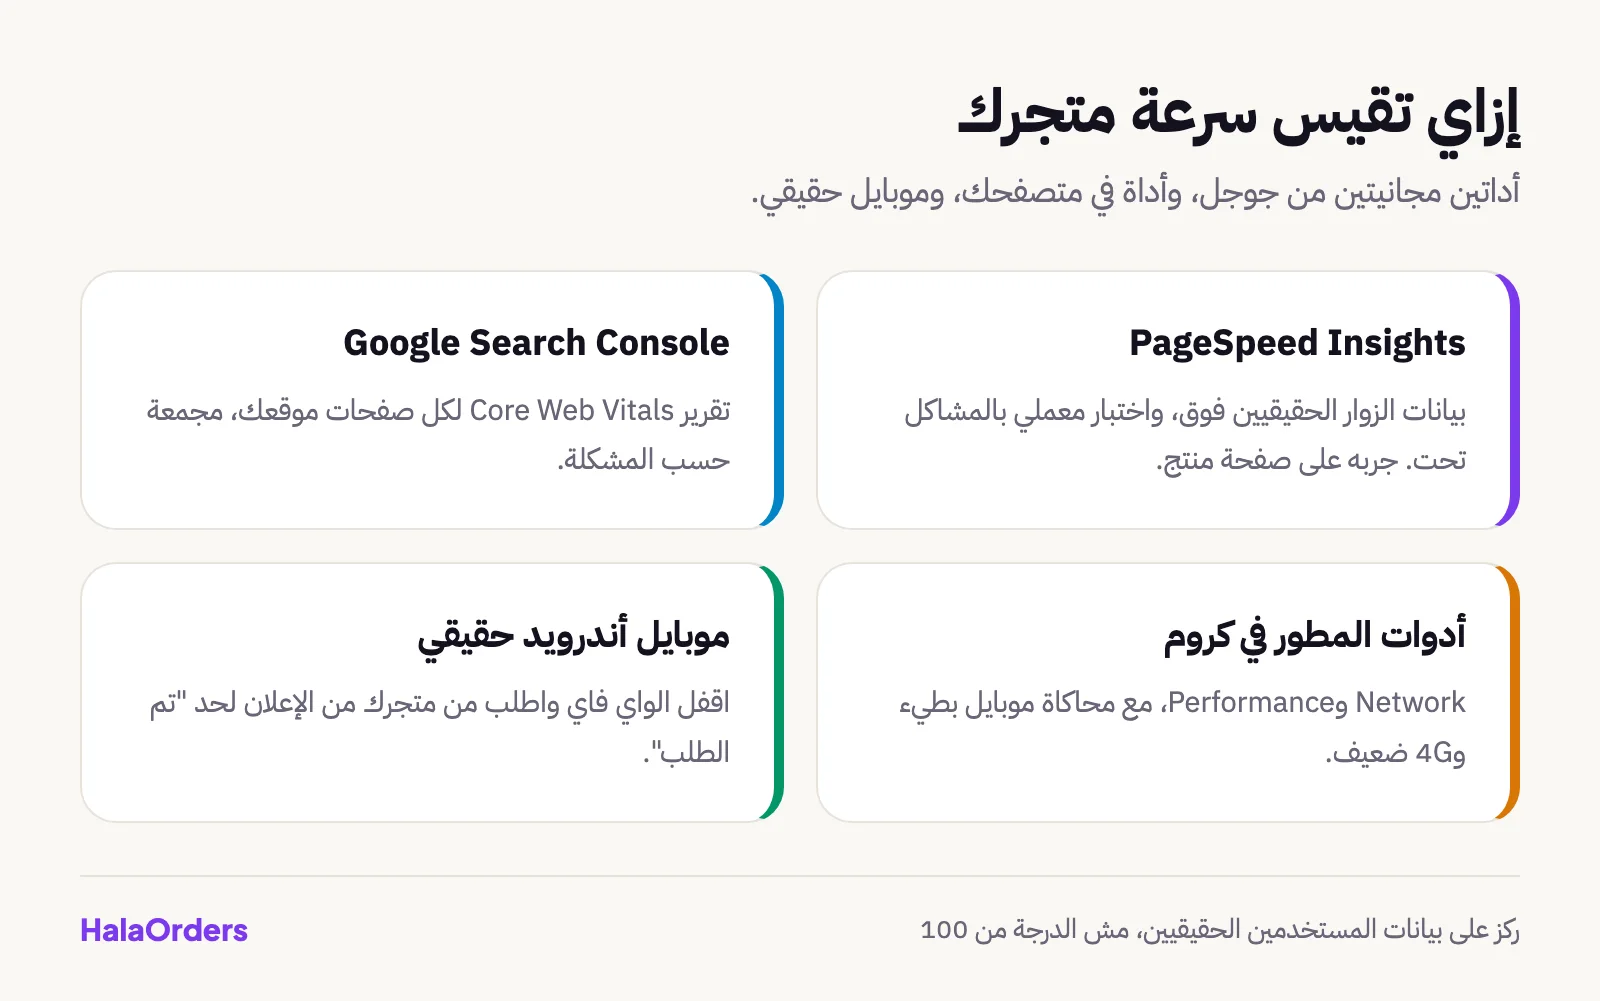
- PageSpeed Insights: enter a product page URL (not just the home page). At the top you will find data from real users if your site has enough visits, and below it a lab test that explains the problems in detail. The real data matters most.
- Google Search Console: has a Core Web Vitals report that groups all your site's pages and tells you which group of pages has a problem.
- Chrome developer tools: the Network and Performance tabs, where you can simulate a slow phone and weak 4G.
- The real test: get a cheap Android phone, turn off Wi-Fi and try ordering from your store, from the ad all the way to the "Order placed" page. No tool will show you what you see with your own eyes.
A common measuring mistake
The PageSpeed score (the number out of 100) isn't the goal. A store can score 65 and sell very well, and another can score 95 in the lab test while its real data is bad. Focus on Core Web Vitals from real users, and on your conversion rate.
A quick checklist
- Product photos are WebP or AVIF, sized for where they appear.
- The main product photo loads with priority, and the rest are lazy.
- Every image and banner has a set width and height.
- There are no unused scripts or add-ons.
- Pixels and analytics don't block the page from rendering.
- The store has an SSL certificate and runs on HTTPS.
- You tried ordering from an Android phone on mobile data.
- You reviewed the Core Web Vitals report in Search Console.
What HalaOrders does for you
If your store is on HalaOrders, a large part of this work is done without you thinking about it:
- Product photos are resized automatically and converted to WebP on upload, along with a small version for lists and cards. Upload the photo from your phone and the platform takes care of it.
- A free SSL certificate on your domain.
- Landing pages are designed mobile first, are lightweight and are independent of the store theme, so a customer coming from an ad lands on one page with the form right there.
- The Meta Pixel, TikTok Pixel and Google Analytics are added from the dashboard with just the ID, without pasting code into the theme.
- A sitemap and clean URLs so Google finds your pages.
The bottom line
Speed isn't a technical luxury; it is part of the buying experience, like the price and the photos. Start with images because they are the biggest win, then clean up the scripts, and measure with real user data, not just the score. And remember this number every time you add something new to your store: 0.1 seconds can be worth 8% of sales.
If you want to know how much speed affects your ad budget, read the conversion rate guide.
Frequently asked questions
Does site speed really affect sales?
Yes. A Deloitte study found that improving mobile speed by 0.1 seconds raised conversion on retail sites by 8.4%, and a Google study found that 53% of mobile visits are abandoned if the page takes longer than 3 seconds.
What are Core Web Vitals?
Three metrics Google uses to measure user experience: LCP (when the largest element appears, good is 2.5 seconds or less), INP (how fast the page responds to a tap, good is 200 milliseconds or less) and CLS (page stability, good is 0.1 or less).
Which format should I use for product photos?
WebP or AVIF. In our test on a real product photo, WebP saved 58% of the original JPEG size and AVIF saved 72%, and all modern browsers support them.
How do I measure my store's speed for free?
Use PageSpeed Insights on a product page, the Core Web Vitals report in Google Search Console, and test it yourself on an Android phone on mobile data.